Dashboard
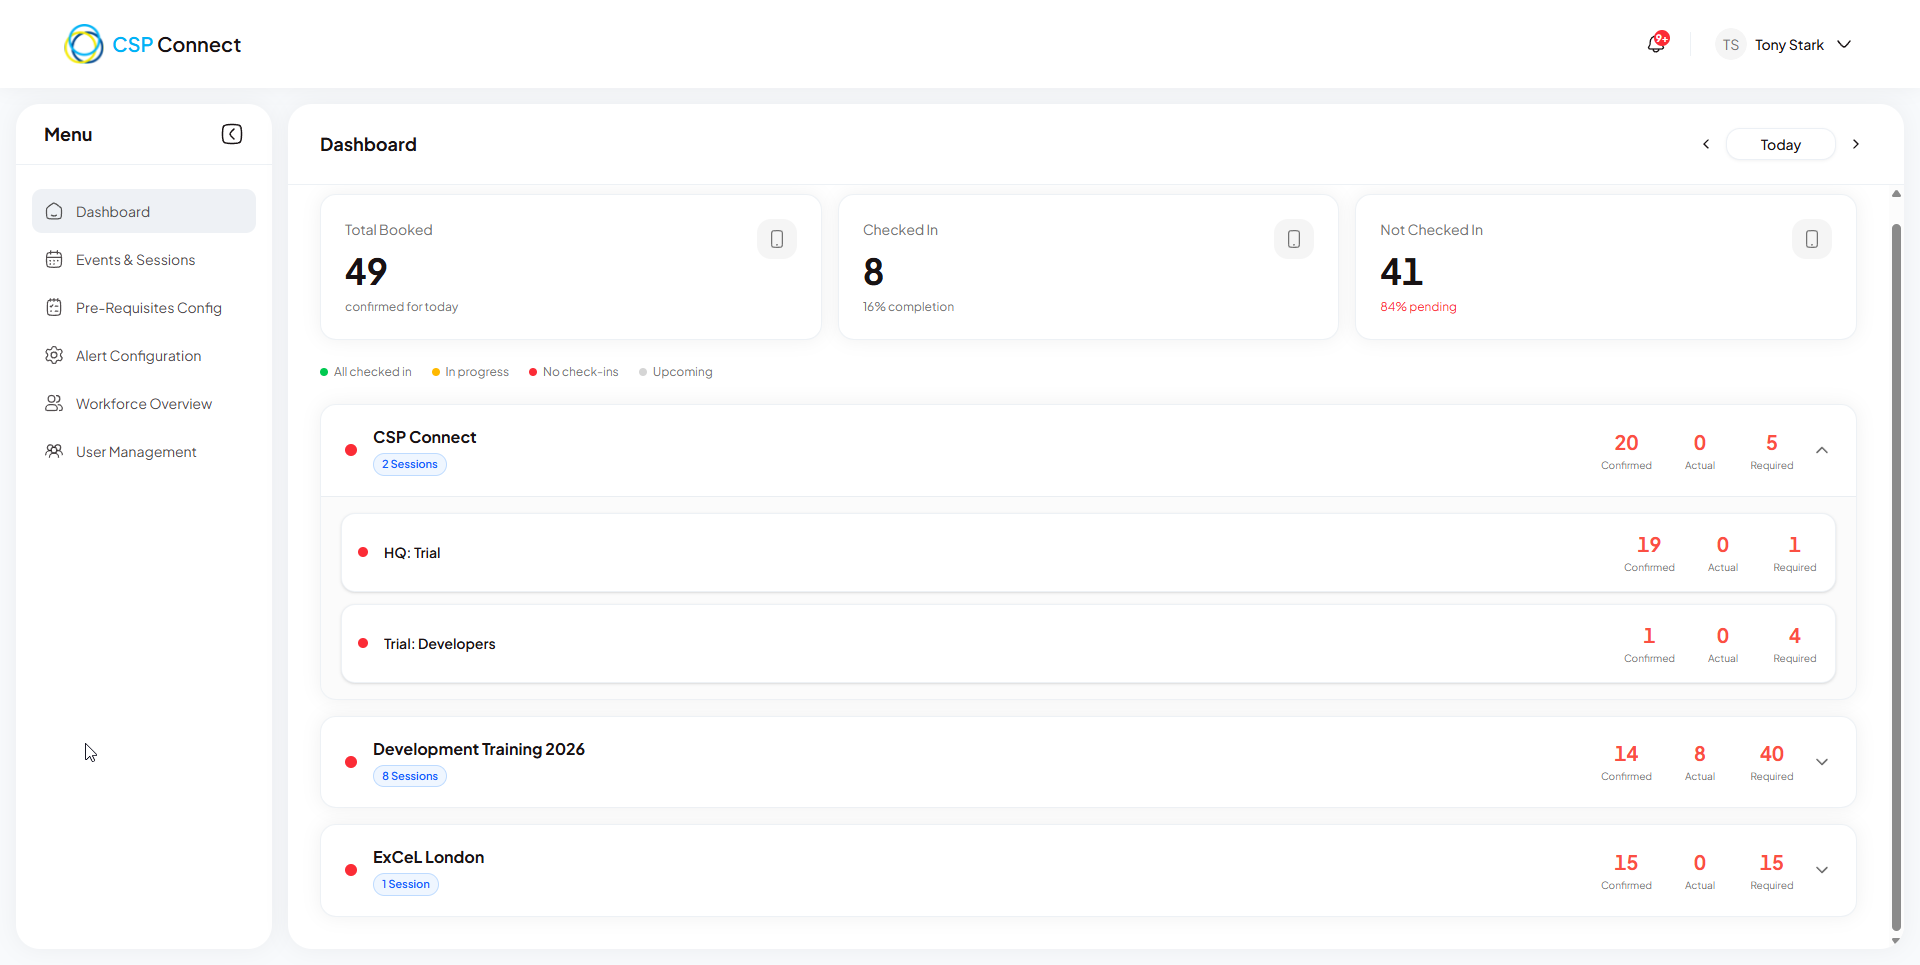
The Dashboard gives admins and managers a real-time bird’s-eye view of all events and sessions for a selected day. Access it from Dashboard in the main navigation.
Overview
Section titled “Overview”The dashboard shows a summary row at the top, followed by a list of event rows for the selected day. Each event row can be expanded to reveal individual session rows.
Summary row
Section titled “Summary row”| Stat | What it shows |
|---|---|
| Total Booked | Total workers with confirmed bookings for the selected day |
| Checked In | Workers who have checked in and are currently on site |
| Not Checked In | Workers whose booking has started but have not yet checked in |
Date selector
Section titled “Date selector”A date picker in the top right defaults to today. Use the ‹ and › arrows or tap the date to navigate to another day.
Event rows
Section titled “Event rows”Each event is displayed as a row showing the event name, session count, and per-event staffing numbers (Confirmed, Actual, Required). A colour-coded dot on the left indicates the current check-in status.
Colour coding
Section titled “Colour coding”| Colour | Label | Condition |
|---|---|---|
| 🟢 Green | All checked in | All workers have checked in and out |
| 🟡 Amber | In progress | At least one worker has checked in but not all have checked out |
| 🔴 Red | No check-ins | No check-ins recorded and the earliest booking start time for the event has already passed |
| ⚪ Grey | Upcoming | The event has not yet started — start time has not passed |
Manager avatars
Section titled “Manager avatars”Each event row shows a stacked avatar group — one avatar per manager assigned across all sessions in that event. Individual session rows show a single avatar for the session’s assigned manager.
Expandable session rows
Section titled “Expandable session rows”Click any event row to expand it and reveal the individual sessions nested within. Click again to collapse. Each session row shows its own Confirmed, Actual, and Required staffing counts alongside the same colour-coded status indicator.